There are a couple ways to extract map tiles from the various archives - the most popular being MBTiles and PMTiles these days. The best way, though, is using tile-join from felt/tippecanoe:
tile-join -e dir/ input.pmtiles
This will output all tiles as a hierarchy in dir - dir/{z}/{x}/{y}.{ext}. When working with vector tiles, you might need to specify -pC (no tile compression). By default, tiles are compressed in the archive, but if you need the raw tiles in a directory, specifying this option will output the raw, uncompressed files.
It’s that time of year again to reflect and think about what’s coming up in the future.
This year was an interesting year, both personally and professionally.
Personal
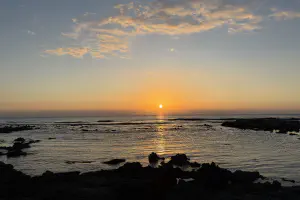
We’re approaching our fourth anniversary of moving to Yakushima (it’ll be exactly four years this coming February), and we’ve been able to make more friends and acquaintances on the island. I’ve also taken up running as a hobby and have gotten involved in the local running community as well.
Until a few months ago, I never really was interested in my age, or the age of people around me. When someone asked me my age, I would have to pause and think about what year it was (a number I often forget) and calculate the years. Being born in 1990, it wasn’t too hard. Just add 10 to the last two numbers of the current year. My birthday is in November, so if it was currently before November, I’d just minus one.
Yesterday was my last day at Geolonia. I had been working at Geolonia since the beginning of 2021, making it just over 3 years. During my time there, I worked on many interesting projects, but I felt that it was time to make a change.
In these 3 years, a lot has changed. The world has seen the rise of LLM-based AI solutions appear and grow rapidly. There are many questions about its effectiveness and ethics, but it’s too late for that now. It’s time to really think about how AI technologies can be used to advance society.
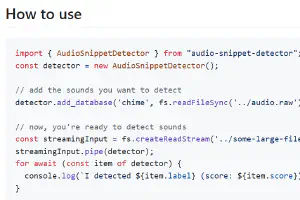
I live in a small town that occasionally broadcasts announcements over the radio. For the past few years, I’ve been building a small Raspberry Pi appliance to transcribe these broadcasts to text. However, there are many broadcasts that don’t contain spoken content, so I wanted a way to recognize the kind of broadcast and make a decision whether to send it to the speech-to-text service or not.
Happy New Year! For the past few years, I’ve been using the year-end break to reflect on the past year and set a theme for the next. Last year, I was mainly focused on doing work at Geolonia and increasing the amount of output in terms of blog posts.
My theme for this year is experimentation. While I’m going to continue working on output – this time, with more focus on my personal blog – I want to work on running focused, meaningful experiements. I generally enjoy trying new things and playing with new toys, but this year, the focus will be less on the playing and more on actually learning from these experiments. I’ve found that I can learn from playing around, but I struggle with deciding when to move on, or whether I should stick around and keep on iterating.
However, updates on this personal blog has been not so great – the previous post is the “2023 review” post, after all.
I’ve been updating this blog from 2012, when we officially incorporated Flagship. I have since left Flagship, but it has a special place in my heart as it was where I learned how to bridge between programming and delivering results.
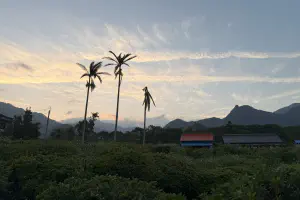
This year was an eventful year. The biggest event was by far moving from Tokyo to Yakushima, but there were a lot of other events that happened this year.
We made the move at the end of February, and my wife and I started out by working in a spare room in her father’s workshop. We then moved our workspace to the house when it was finished around July. During that time, I’ve worked on a few things at Geolonia, including growing the engineering team by a couple people and creating a few new products with the team.
I often get asked why I prefer Terraform over CloudFormation. I just ran into a nitpick of CloudFormation and decided to write this post before I forget about it.
So, I’m currently working on a relatively simple CloudFormation document that includes a CloudFront CDN that is in front of a S3 bucket. It also includes dependencies: the S3 bucket policy and the CloudFront Origin Access Identity. On my first try, I got something wrong in the CloudFront settings. OK, fine, I’ll fix it. It was a silly one-line mistake. Wait for cleanup to finish, removing the S3 bucket. Next, a mistake in the bucket policy. Another simple fix. This time the CloudFront distribution was already created, so I was already waiting for 3-5 minutes (I am so glad that it wasn’t 30 minutes like just a few years ago!). Wait for another 5-10 minutes for the distribution to be deleted and created again.
With the release of the Mac Studio recently – something that, for quite a long time, I thought I had been waiting for – I started thinking about what the ideal desktop environment for me is. This is what I use currently:
A PC (i9-10900k with 32GB of RAM) running Ubuntu, hooked up to a 28-inch 4K monitor.
A MacBook Air (M1, 2020 model)
I used to run macOS on the PC, but that experiment finished after a year or so. It was pretty stable and I had almost no problems, but hardware compatibility and performance was lacking. (Having a very Docker and Linux heavy workload meant that most of the time I was running Linux, virtualized in macOS, anyways, so I thought – hey, it would be better to just run Linux anyways, right?)