Serving real-time, tiled, point data directly from DynamoDB part 2 - the plan
I previously wrote about something I wanted to do with DynamoDB and geospatial data, and got a lot of responses on Twitter.
In the end, I think I’m going to go with a hybrid approach — using Uber’s H3 geocoding algorithm to generate clusters and to take care of indexing points, and then generating vector tiles as a separate process based on that data.
Here’s a bird’s-eye view of how the data will flow.
DynamoDB
trigger
DynamoDB…
New Point
H3 Index resolution 9
PK = PointData#89283470d93ffff
SK = {ULID}
New Point…
when n=0
when n=0
Refresh H3 Aggregation
H3 Index resolution n-1
PK = HexAgg#88283472b3fffff
SK = {ULID}
Refresh H3 Aggregation…
until n=0
until n=0
Generate Vector Tile
Tile Zoom n-1
PK = GenTile#z/x/y
SK = {ULID}
Generate Vector Tile…
until n=0
until n=0Viewer does not support full SVG 1.1
And here’s the plan:
- A point is created/updated/deleted. This point has a H3 index resolution of 9, and looks something like this. I probably would be able to get away with resolution 8, but I’m going with 9 for now because it’s a good resolution for clusters when zoomed out.
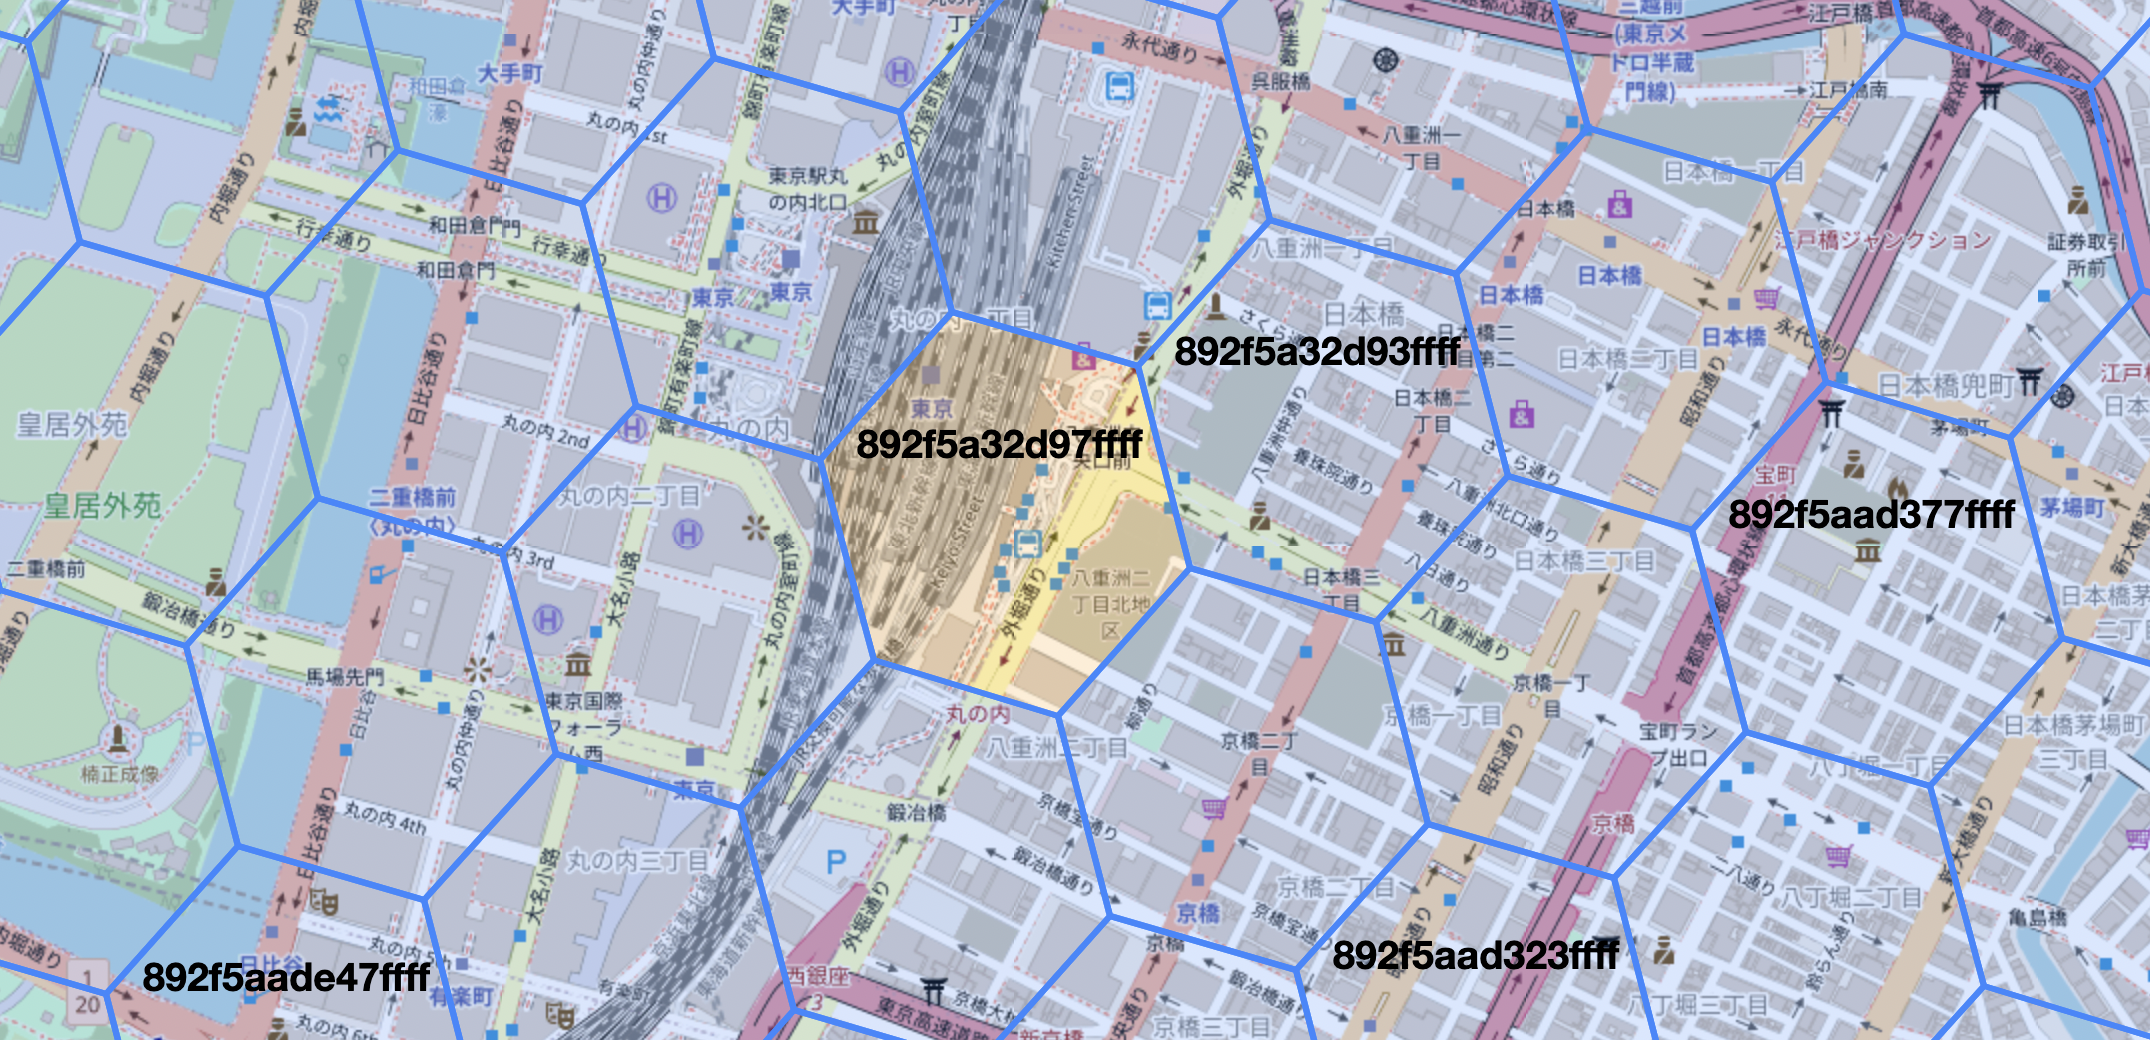 (map data is © OpenStreetMap contributors, the hexagon grid viewer is clupasq/h3-viewer)
 - This event is passed off to a function that calculates the parent hexagon of the point at resolution
n-1(for the first iteration, this would be 8). Then, all points within this hexagon are queried and aggregated, and written to an aggregation corresponding to resolutionn-1. This function loops until we get to resolution 0. - After the aggregation hexagons have finished calculating, we will do a similar process for generating the actual vector tiles. Some kind of mapping will have to be made between zoom levels and H3 resolutions, but this is going to be highly subjective and I plan to figure it out on the fly.
And that’s about it — all I have to do now is actually implement it. I have a few worries about what the end result is going to turn out: higher level aggregations not being perfect due to hexagons not cleanly subdividing, or positions of clusters not lining up with the data (for example, if the data in a hexagon is heavily weighted to one side, showing a corresponding cluster at the center of the hexagon would not be appropriate)… These problems will become apparent when I start the implementation, and I already have seeds of ideas that I might be able to use to mitigate them.
Anyway, that’s it for today. Thank you to everyone who responded to my tweets! If you have any comments, please don’t hesitate to comment.