Categories
English

2023 in Review

This year was an eventful year. The biggest event was by far moving from Tokyo to Yakushima, but there were a lot of other events that happened this year.

We made the move at the end of February, and my wife and I started out by working in a spare room in her father’s workshop. We then moved our workspace to the house when it was finished around July. During that time, I’ve worked on a few things at Geolonia, including growing the engineering team by a couple people and creating a few new products with the team.

Additionally, I’ve been able to work on a few projects that I’ve always wanted to do around the house — setting up a simple router with OpenWrt, putting all the networking gear / NAS in a separate room, and wiring Ethernet.

Projects that I want to work on this year include:

  • Write some more English blog posts (both here and on yakushima.blog)
  • Building a Raspberry Pi weather station outside.
  • Work on the outdoor parts of the house. I think we’ll need a small shed to store basic tools. (I could actually dedicate a section of the shed to the Raspberry Pi…)
  • Improve the drainage around the house. We did a bit of work this year, but it’s still susceptible to some flooding during heavy rains. Hopefully I’ll have a little better solution built before the rainy season next year.
  • I’m planning on dedicating a section of land to growing food — I think we’re going to start by trying to grow some sweet potatoes.
  • And other general tinkering around.

All in all, this year was pretty good. I’m really looking forward to next year.

Categories
日本語

防災放送をデジタル化してみた: 続き

最初の記事は引っ越して1ヶ月で書きましたが、そこからだいぶ経ちました。。その間色々ありましたが、地道に改善を追加しています。最初公開したときに比べると、こういうところを改善しています:

  • 文字起こしエンジンを Amazon Transcribe から Google Speech-to-Text に切り替え
  • デプロイ周りは GitHub Actions から行うように
  • モバイル通知の対応

まずは文字起こしエンジンから。

Amazon Transcribe から Google Speech-to-Text に切り替え

公開後、文字起こしの精度をどう上げるか考えていました。試したのは3件のサービス: Amazon, Azure と Google。結局 Google を採用しましたが、その理由は聞き取り精度のためでした。完璧というわけではないのですが、 Amazon と Azure よりはマシでした。 Azure は自分の音声とトランスクリプトを用意すればさらにカスタマイズしたサービスを作ることができるらしいけど、今回のサービスとしては金額的に高すぎました。今のところ Google で数ヶ月運用していますが、文字起こし費用は月200円未満。台風が多かった時期は500円程度。

OpenAI が ChatGPT などで有名ですが、 Whisper という文字起こしモデルも公開しています。こちらも試してみたのですが、致命的な課題がありました。

幻覚症状がどうしてもコントロールできなかった。大体のお知らせは「お知らせ終わります。【終わりのチャイム音】」で終わりますが、 Whisper の解釈は「お知らせ終わります。ご視聴ありがとうございました」でした。

今後改善されるか、私の設定が悪かったのか、GPT-4とかで直すした方がいいのかまだはっきりわかりませんですが、今のところその4つのサービスのうち Google が優位。

デプロイ周りは GitHub Actions から行うように

前の記事では、Raspberry Pi にログインして git pull するというデプロイ手順でしたが、さすがに面倒でした。実物サーバーにデプロイするのは久しぶりで不慣れなところが色々ありましたが、結局ある程度スムーズにできるようになりました。現在はこういう流れになっています:

  1. GitHub Actions でフロント/バックエンドが両方コンパイルされる
  2. Raspberry Pi に tailscale を使って SSH で接続する
  3. 新しいファイルを rsync でコピーする
  4. Raspberry Pi 内で npm install 行う
  5. アプリサーバーを再起動する

ここで一番助かっているのは tailscale です。tailscale は VPN アプリでもあるのですが、ネットワークに繋ぐようなVPNではなく、peer-to-peer みたいな感じでクライアントがインストールされているなら直接接続できる様なVPNです。デプロイ先の Raspberry Pi に tailscale のクライアントの入れ、 GitHub Actions 用の Action を設定すれば、ポート開けとかNAT調整とかファイアウォール設定とかしなくてもGitHub ActionsからSSH通信できます。

モバイル通知の対応

iOS 16.4 が前の記事の翌?翌々?日にリリースされ、ネイティブアプリなしでもバックラウンドでプッシュ通知をサーバーから受け付けられる様になりました。(Androidはこの機能数年前ぐらいに追加されたらしいですが、私は iOS しか使っていません。。)

ただ、ちょっとハマったのは、通知を受け取る様になるために、ユーザーがこのサイトをホーム画面に追加しなければならない。この操作は一般的ではないため説明するのがいつも混乱します。

終わりに

さらに改善を続けたいと思います。今はこんな形で考えています:

  • 音声認識の半ローカル化
    • 現在、時報とお知らせをどう区別しているかというと、文字起こしサービスから文字が返ってきてるかで判定しています。文字起こしサービスは入力の音声の時間で課金されるので、内容があるお知らせのみ文字起こしすれば節約できる。また、お知らせ終了後の録音終了判定がより正確になります。
  • 文字起こし精度向上
    • OpenAI の Whisper モデルもそうですが、ローカルで動かせるモデルも色々あるのでそういうのも試してみたい。
    • もし自分の音声でトレーニングできるモデルもあればそれで試してみたい。それぞれのサービスは辞書の機能はありますが、ほとんど効かないので最初から教師データを設定したい。
  • お知らせ内容の要約
    • ChatGPT や GPT-4 を使って要約を作ってみましたが、一貫性を保った出力を制御するのがやや難しい様です。

最後まで読んでいただきありがとうございました。もし質問などあれば遠慮なく連絡ください。

Categories
日本語

防災放送をデジタル化してみた

約1ヶ月前に、屋久島に移住しました。屋久島の安房地方は、防災放送が結構回数が多くて、存在感があります(詳しくは、放送についてのブログを書いたので興味あれば読んでください)。たまに、重要な情報も流れます。ただ、聞き逃しや聞き違いとかあるので、移住前からでも、サイト化できないかと思って考え始めた。

実際に移住してからちょっと時間ができましたが、こんなの作れました。

「エリアトーク」という、自治体の放送を自宅でも受信できる機械があったので、この音声の出力を Raspberry Pi に繋いでた USB 音声入力に繋いだ。そこから、 sox を使って一定音量以上になるとストリームを Amazon Transcribe に送りながら録音し、自動で更新する文字起こしサイトを作った。

https://bousai.yakushima.blog/

ソースコードは GitHub で公開しています。かなり適当な作りになっているけど今後時間ある時に改善いきたいと思っています。

わかったこと・今後改善予定のこと

まずは自動文字起こし。私は AWS に一番慣れているのでデフォルトで Amazon Transcribe を選んだんですが、精度がかなり低い。カスタムの辞書(よく使われる言葉集的なもの)の機能はあるけど、かなり使いにくい。よく登録する時にエラーになったり、やっとうまく登録できた!と思ったら5分後確認したらモデル生成にエラーが発生しました、とかというのありました。

そのところで、違うプロバイダーを探し始めた。 Google と Azure も似たようなサービスがあり、 Amazon より10倍ぐらいの精度だった。正直びっくりしました。

Google も Azure も両方カスタム辞書を登録するのが楽でした。 Azure はカンマ区切りの、漢字の文字をそのまま列挙すればいい。Googleはいちいち登録する手間はあったけど、その代わりそれぞれの登録単語やフレーズに重みをつけることもできた(モデルによって使ったり使えなかったりするみたいだけど)。

結局は、Google にしようと思います。それが一番先に改善するところ。

他は、下記の改善を考えています

  • 定時チャイムの取り除き (文字起こし文が無いのを隠せばいいだけなので比較的楽そうですね)
  • デプロイフロー (今はサーバーとフロントを全部 Raspberry Pi にログインして git pull 的な感じでデプロイしています。。笑)
  • UI (今は1時間ぐらいかけて作ったものだけど、もうちょっとかっこよくしたい)
  • RSS (僕はニュースを基本的に NetNewsWire で読んでいるのでそれと連携すれば最高だなと思いました。。)
  • モバイル通知 (iOS 16.4 からアプリなしでも通知が送られるみたい)

こういった形で、ぼちぼちと暮らしを改善して行きたいと思っています。

Categories
English

Why I prefer Terraform over CloudFormation

I often get asked why I prefer Terraform over CloudFormation. I just ran into a nitpick of CloudFormation and decided to write this post before I forget about it.

So, I’m currently working on a relatively simple CloudFormation document that includes a CloudFront CDN that is in front of a S3 bucket. It also includes dependencies: the S3 bucket policy and the CloudFront Origin Access Identity. On my first try, I got something wrong in the CloudFront settings. OK, fine, I’ll fix it. It was a silly one-line mistake. Wait for cleanup to finish, removing the S3 bucket. Next, a mistake in the bucket policy. Another simple fix. This time the CloudFront distribution was already created, so I was already waiting for 3-5 minutes (I am so glad that it wasn’t 30 minutes like just a few years ago!). Wait for another 5-10 minutes for the distribution to be deleted and created again.

The simple solution is: don’t make mistakes. But that’s not how I develop software. I make tons of mistakes until it’s working the way I want it to work. CloudFormation is not conducive to that kind of development, and it really slows the development process down.

In contrast to Terraform, I would have been able to use the partially built resources (there were no problems with those resources itself) and I would have been able to get it to the level I wanted in less than a tenth of the time.

I understand why CloudFormation is the way it is, and it is a deliberate decision by the CloudFormation team — it’s better to roll back to a known good state than to have half-complete infrastructure. But it just doesn’t work with my infrastructure development process.

I haven’t tried CDK out yet. However, it just seems like it compiles code down to CloudFormation, which means it wouldn’t really help with this particular problem I just had.

Categories
English GIS

Creating Vector Tiles from Scratch using TypeScript

I currently work at a Japanese mapping startup called Geolonia. We specialize in customizing and displaying geospatial data, and a big part of this is making vector tiles. There are a lot of ways to do this, the most popular being tippecanoe from Mapbox, ST_AsMVT in PostGIS, OpenMapTiles, and tilemaker. We normally use tippecanoe to convert GeoJSON data to vector tiles and tilemaker to generate OpenStreetMap-based tiles, but there isn’t really an easy way to generate arbitrary vector tiles in plain old TypeScript / JavaScript.

Recently, I’ve been working on a proxy for converting data directly to vector tiles on the fly, and that is exactly what I need to do — generate arbitrary tiles without relying on outside processes like tippecanoe or PostGIS (this specific proxy will be running in AWS Lambda).

The Mapbox Vector Tile (MVT) spec is the de-facto standard for delivering tiled vector data, and that’s what we’ll be using. MVT tiles are Protocol Buffers-encoded files that include the drawing instructions for map renderers. The MVT spec handily includes the protobuf definition file, so we can use this to compile to JavaScript and generate the TypeScript definition files.

For the following, I’m assuming you have a git repository with the basic JavaScript and TypeScript essentials already set up.

Working with the MVT format in TypeScript

First, we create a submodule to bring in the MVT protobuf definition.

git submodule add https://github.com/mapbox/vector-tile-spec.git

This should create a new directory vector-tile-spec, with the contents of the MVT vector tile specification repository inside. Now, we can set up the protobuf-to-JS compiler.

My project uses ES modules, so these instructions will generate ES modules, but if you need something else, check out the protobufjs documentation.

In package.json, create a new script called build:protobuf:

"scripts": {
  ...
  "build:protobuf": "pbjs -t static-module -w es6 -o src/libs/protobuf.js vector-tile-spec/2.1/vector_tile.proto && pbts -o src/libs/protobuf.d.ts src/libs/protobuf.js"
}

Install protobufjs:

npm install --save protobufjs

Now, we’re ready to generate the code.

npm run build:protobuf

This command will generate two files: src/libs/protobuf.d.ts and src/libs/protobuf.js. Now, we’re ready to generate tiles.

The Mapbox Vector Tile format

Mapbox provides a very good guide on how data is laid out in the MVT container in their documentation. I highly recommend reading through it, but here are a few takeaways especially relevant to us:

  • Feature property values and keys are deduplicated and referred to by index.
  • Coordinates are encoded using “zigzag” encoding to save space while supporting negative coordinates. Starting from zero, 0, -1, 1, -2, 2, -3, 3…
  • Drawing points, lines, and polygons differ from GeoJSON in a few major ways:
    • Instead of absolute coordinates, drawing is done using a cursor and relative coordinates to the last operation.
    • Instead of declaring whether a geometry is a point, line, or polygon, MVT uses commands to imperatively draw geometry.
    • Coordinates are local to the tile, where (0,0) refers to the top-left corner of the tile.

Now that we’re ready to jump in to actually building up these tiles, let’s try some code.

import { vector_tile } from "../libs/protobuf";

// zigzag encoding
const zz = (value: number) => (value << 1) ^ (value >> 31);

const tile = vector_tile.Tile.create({
  layers: [
    {
      version: 2, // This is a constant
      name: "test", // The name of the layer
      extent: 256, // The extent of the coordinate system local to this tile. 256 means that this tile has 256×256=65536 pixels, from (0,0) to (256,256).
      features: [
        {
          // id must be unique within the layer.
          id: 1,
          type: vector_tile.Tile.GeomType.POLYGON,
          geometry: [
            // We start at (0,0)
            ((1 & 0x7) | (1 << 3)), // MoveTo (1) for 1 coordinate.
              zz(5), zz(5), // Move to (5,5)
            ((2 & 0x7) | (3 << 3)), // LineTo (2) for 3 coordinates.
              zz(1),  zz(0), // Draw a line from (5,5) to (6,5)
              zz(0),  zz(1), // Draw a line from (6,5) to (6,6)
              zz(-1), zz(0), // Draw a line from (6,6) to (5,6)
            15, // Close Path (implicitly closes the line from (5,6) to (5,5))
          ],
          tags: [
            0, // test-property-key-1
            0, // value of key 1

            1, // test-property-key-2
            1, // value of key 2 and 3

            2, // test-property-key-3
            1, // value of key 2 and 3
          ],
        }
      ],
      keys: [
        "test-property-key-1",
        "test-property-key-2",
        "test-property-key-3"
      ],
      values: [
        {stringValue: "value of key 1"},
        {stringValue: "value of key 2 and 3"},
      ],
    }
  ]
});

I tried to annotate the code as much as possible. Can you figure out what shape this draws?

Now, to convert this to binary:

const buffer: Buffer = vector_tile.Tile.encode(tile).finish();

And that’s it!

Conclusion

I was initially pretty scared about creating vector tiles from scratch — I’ve found them pretty hard to work with in the past, leaning on tools like vt2geojson to first convert them to GeoJSON. I was pleasantly surprised to find out that it wasn’t as hard as I thought it was going to be. I still got stuck on a few parts — it took me a few trial and error runs to figure out that my absolute-to-relative math was off — but once everything was working, it was definitely worth it.

Let me know what you think.

Categories
English

My Desktop Environment

With the release of the Mac Studio recently — something that, for quite a long time, I thought I had been waiting for — I started thinking about what the ideal desktop environment for me is. This is what I use currently:

  • A PC (i9-10900k with 32GB of RAM) running Ubuntu, hooked up to a 28-inch 4K monitor.
  • A MacBook Air (M1, 2020 model)

I used to run macOS on the PC, but that experiment finished after a year or so. It was pretty stable and I had almost no problems, but hardware compatibility and performance was lacking. (Having a very Docker and Linux heavy workload meant that most of the time I was running Linux, virtualized in macOS, anyways, so I thought — hey, it would be better to just run Linux anyways, right?)

I think the setup I have now gets 95% of the way there, but it is far from perfect. There is a long list of nitpicks for both macOS and Ubuntu Linux, but they both have their time and place in my workflow.

For example, macOS has excellent keyboard shortcuts (the command key is the “killer feature” for me), a healthy ecosystem of apps (I’m still waiting for something like iTerm 2 for Linux, currently using WezTerm), and a general cohesiveness between apps. On the other hand, some programs just run much more smoothly on Linux: QGIS and Docker, to name the biggest pain points on macOS for me.

I then thought: if money was no object, what would I do? Would I throw away all my Linux stuff and go all-in on the fully loaded Mac Studio? Honestly, probably. But still — the M1 Ultra is “only” 20 cores. I could get a Threadripper system with 64 cores and 128 threads, with more IO than I could use and be happy with that for years.

So, I guess this all boils down to two paths: continue the dual Linux-Mac lifestyle, or relegate the PC to PC gaming and do all my work on the Mac.

Continuing down the dual Linux-Mac path probably means a little beefier workstation in a few years (I got the i9-10900k for macOS compatibility, if it’s just going to run Linux I would be able to get a Threadripper). Moving work back to the Mac means I’d have to work on the KVM setup.

Honestly, I think I’m going to continue dual Linux-Mac, at least for the next few years. I’m satisfied with my M1 MacBook Air, and for CPU heavy tasks I do, the i9-10900k is a great balance between power and versatility. Additionally, desktop Linux has gotten so much better. I’ve tried various distributions of Linux as my daily driver at various points of time in the past, but this is the first time that I’ve used it every day for more than a few months.

I’ve always wanted to get in to desktop Linux development. Maybe now’s the time to get more involved in the apps I use every day.

Categories
GIS

Serving real-time, tiled, point data directly from DynamoDB part 2 – the plan

I previously wrote about something I wanted to do with DynamoDB and geospatial data, and got a lot of responses on Twitter.

In the end, I think I’m going to go with a hybrid approach — using Uber’s H3 geocoding algorithm to generate clusters and to take care of indexing points, and then generating vector tiles as a separate process based on that data.

Here’s a bird’s-eye view of how the data will flow.

DynamoDB
trigger
DynamoDB…
New Point
H3 Index resolution 9
PK = PointData#89283470d93ffff
SK = {ULID}
New Point…
when n=0
when n=0
Refresh H3 Aggregation
H3 Index resolution n-1
PK = HexAgg#88283472b3fffff
SK = {ULID}
Refresh H3 Aggregation…
until n=0
until n=0
Generate Vector Tile
Tile Zoom n-1
PK = GenTile#z/x/y
SK = {ULID}
Generate Vector Tile…
until n=0
until n=0
Viewer does not support full SVG 1.1

And here’s the plan:

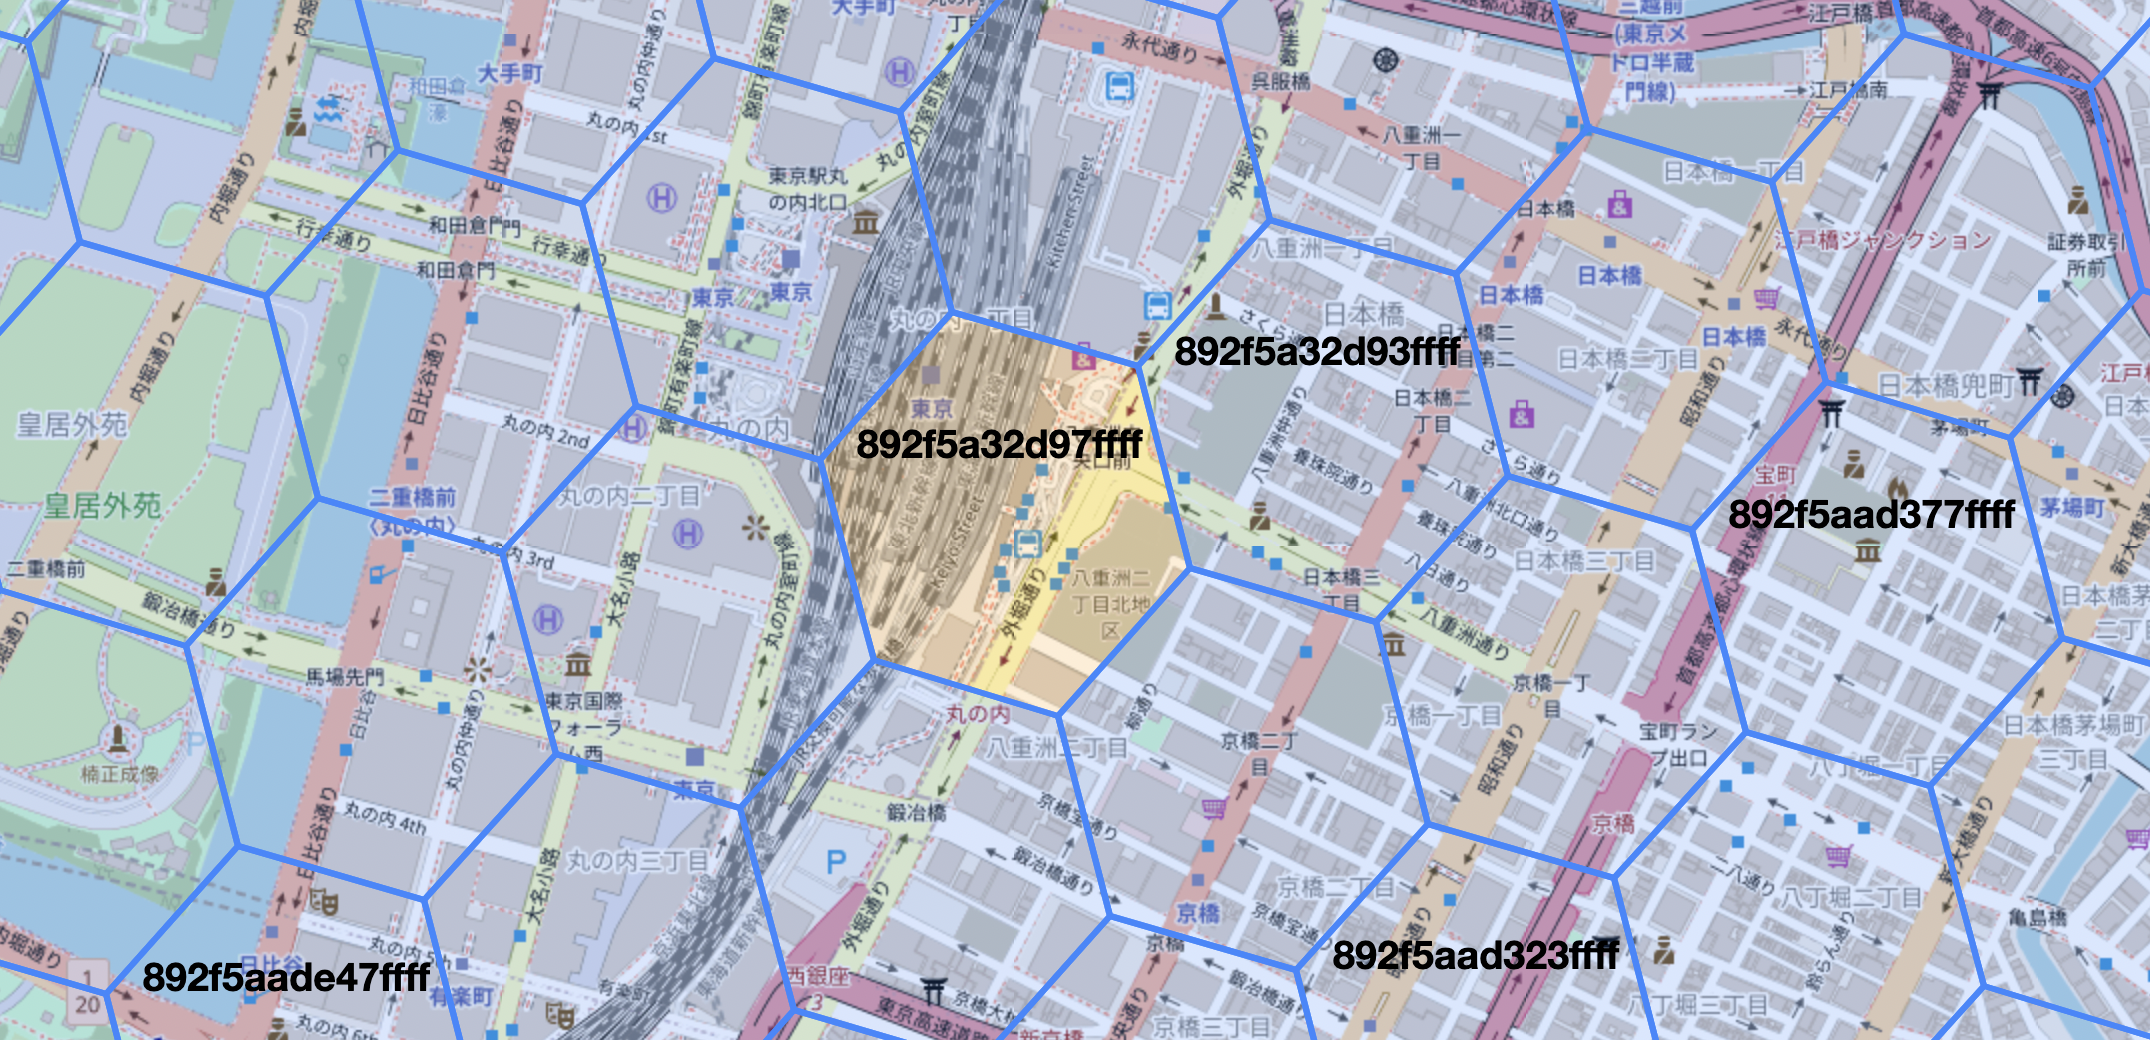
  1. A point is created/updated/deleted. This point has a H3 index resolution of 9, and looks something like this. I probably would be able to get away with resolution 8, but I’m going with 9 for now because it’s a good resolution for clusters when zoomed out.A screenshot of a highlighted H3 resolution 9 hexagon encompassing a portion of Tokyo Station(map data is © OpenStreetMap contributors, the hexagon grid viewer is clupasq/h3-viewer)
  2. This event is passed off to a function that calculates the parent hexagon of the point at resolution n-1 (for the first iteration, this would be 8). Then, all points within this hexagon are queried and aggregated, and written to an aggregation corresponding to resolution n-1. This function loops until we get to resolution 0.
  3. After the aggregation hexagons have finished calculating, we will do a similar process for generating the actual vector tiles. Some kind of mapping will have to be made between zoom levels and H3 resolutions, but this is going to be highly subjective and I plan to figure it out on the fly.

And that’s about it — all I have to do now is actually implement it. I have a few worries about what the end result is going to turn out: higher level aggregations not being perfect due to hexagons not cleanly subdividing, or positions of clusters not lining up with the data (for example, if the data in a hexagon is heavily weighted to one side, showing a corresponding cluster at the center of the hexagon would not be appropriate)… These problems will become apparent when I start the implementation, and I already have seeds of ideas that I might be able to use to mitigate them.

Anyway, that’s it for today. Thank you to everyone who responded to my tweets! If you have any comments, please don’t hesitate to comment.

Categories
English GIS

Serving real-time, tiled, point data directly from DynamoDB

Recently, I’ve been interested in how to serve and work with geographic data with the least amount of “work” possible. Everything here can be done pretty easily with PostGIS and a large enough server, but I’m always up for the challenge of doing things in a slightly different way.

I’m working on an app that will store lots of points around the world — points that people have submitted. Users will open this app, and be presented with a map with points that have been submitted in their vicinity. Once they zoom out, I want to show clusters of points to the users, with a number showing how many points are represented in that cluster.

There are two major ways to do this:

  • Get the bounding box (the coordinates of what the user’s map is currently displaying), send it to the server, and the server will return a GeoJSON object containing all the points in that bounding box.
  • Split the data in to predefined tiles and the client will request the tiles that are required for the current map.

There are pros and cons for both of these methods:

  • GeoJSON would contain the raw data for all points within the bounding box. When the user is zoomed in, this is not a big problem, but when they’re zoomed out, the client will have to do a lot of work calculating clusters. Also, as the user pans around, new queries would have to be made to piece together the point data for areas they don’t have the data for. Not only can this data get pretty big, the user experience is subpar — data is normally loaded after the map pan finishes.
  • Tiles at the base zoom level (where all data is shown, without any clustering) can be generated on-the-fly easily, but tiles at lower zoom levels need to use all of the information in the tile bounds to generate clusters.

This basically boils down to two solutions: let the client process the data, or let the server process the data. Serving the whole GeoJSON document may work up to a point (I usually use something like 1-2MB as a general limit), datasets larger than that need to be tiled. I use Mapbox’s tippecanoe for this, but tippecanoe takes a GeoJSON file and outputs a static mbtiles file with precomputed tiles. Great for static data, but updating this means regenerating all the tiles in the set.

This is where the title of this post comes in. I’ve been thinking about how to serve multiple large tilesets directly from DynamoDB, and I think I have a pretty good idea of what might work. If there’s something like this that already exists, or you find something wrong with this implementation, please let me know!

Here is the basic data structure:

PKSK
Raw DataTileset#{tileset ID}#Data#{first 5 characters of geohash}{full geohash}#{item ID}
Pregenerated TileTileset#{tileset ID}#Tile#{z}/{x}/{y}{generated timestamp}

This is how it’s supposed to work: raw point data is stored conforming to the “Raw Data” row. Updates to raw data are processed by DynamoDB streams, and a message to update the tiles that point exists in is enqueued.

Because this potentially can get very busy (imagine a case where hundreds or thousands of points in the same tile are updated within seconds of each other), the queue would have a delay associated with it . The processor that generates tiles based on messages in the queue would take a look at the tile it’s about to generate, and compare the generated timestamp with the timestamp of the item update. If the tile timestamp is newer then the item, that item can be safely disregarded, because another process has already picked it up.

I initially thought about using tile numbers to index the raw data as well, but decided to use geohash instead. The reasoning behind this is because geohash is a Z-order grid, we can use this property to optimize DynamoDB queries spanning multiple cells. Another problem with using tile numbers is the ambiguity of points that lie on tile boundaries. In contrast, the precision of a geohash can be arbitrarily increased without affecting queries.

Is there a way to encode tile numbers in to a Z-order curve? Maybe interpolating the X and Y values bitwise? How can this account for the zoom parameter? Am I overthinking this? Can I get away with using a sufficiently high zoom parameter (like z=22 or 23)? (How about a crazier idea: can the geohash algorithm be massaged in to corresponding directly to tiles? Is it worth it?)

Anyways, this is sort of something that I’ve been thinking about for a while, and I want to get started on a proof-of-concept implementation in the near future. Let me know on Twitter if you have any input / comments, or even better, if you want to collaborate with me on making something like this.

Categories
AWS

Working with DynamoDB Global Tables

Just some stuff I’ve picked up while working with DynamoDB Global Tables. This was my first time using it; I used it to move a few tables from one region to another without downtime.

When deleting replica tables…

Note that this operation will delete the replica table and is non-reversible. This replica table cannot be re-added later to the global table.

This warning message is a little misleading — the replica table will be deleted, but it’s possible to re-create a new replica table in the region that was deleted.

Replica cannot be deleted because it has acted as a source region for new replica(s) being added to the table in the last 24 hours.

You have to wait for 24 hours before you can delete the source region.

Other stuff:

  • If you create a GSI in one region, it will automatically be created in all other regions as well.
  • If you delete a table from the list of tables (instead of the “Global Tables” tab), it will delete normally. All of the other tables in other regions will be unaffected.
Categories
English

For those times you don’t want to eval…

I wanted to make some advanced logic available, easily configurable via a database, in a couple apps that I’ve been working on recently.

Honestly, I could have just stored the code in the database and eval’d it — but no, I don’t want to take the risk of arbitrarily executing code. I could have done some gymnastics like running it in a network-less container with defined inputs and outputs. I could have made the configuration more capable. What I decided to do in the end, though, was to write an extremely compact domain-specific language (DSL).

To write this DSL, I chose a Lisp-style syntax due to its dead-simple parsing. The basic idea is to parse the string for tokens, generate an abstract syntax tree (AST), then just recurse through the AST and run whatever code is required.

In one example, I wanted to have an extendible SQL WHERE clause, with a very limited set of operators — AND, OR, LIKE, =.

(and (like (attr "person.name") (str "%Keita%")) (= (attr "person.city) (str "Tokyo")))

This example will generate the SQL WHERE clause:

((person.name LIKE '%Keita%') AND (person.city = 'Tokyo'))

Here’s pseudocode for how I write the parser / interpreter for this:

COMMANDS = {
  "and": (left, right) => { return f"(({left}) AND ({right}))" }
  "or":  (left, right) => { return f"(({left}) OR ({right}))" }
  "like":(left, right) => { return f"(({left}) LIKE ({right}))" }
  "=": (left, right) => { return f"(({left}) = ({right}))" }
  "str": (str) => { return escape_sql(str) }
  "attr": (str) => { return escape_sql_for_attr_name(str) }
}

def parse_ast(code):
  # parse the "code" string into nested arrays:
  # "(1 (2 3))" becomes ["1", ["2", "3"]]
  ...

def execute_node(ast):
  cmd = ast[0]
  argv = ast[1:]
  resolved_argv = [ execute_node(x) for x in argv ]
  return COMMANDS[cmd](*resolved_argv)

def execute(code):
  ast = parse_ast(code)
  execute_node(ast)

As you can see, this is a very simple example that takes the DSL and transforms it in to a SQL string. If you wanted to do parameterized queries, you might return a tuple with the string as the first element and a map of parameters for the second, for example.

The ability to map the language so closely to the AST, and being able to evaluate the AST just by recursion, makes this implementation simple and easy to write, easy to extend, and easy to embed in existing applications. While I probably won’t be switching to writing Common Lisp full time (for practical reasons), I definitely do get the appeal of the language itself.

This tool isn’t something I use all the time. It’s probably something that should be used very sparingly, and in specific circumstances. That said, it’s a good tool in my toolbox for those times for when I want to have on-the-fly customizable logic without the security concerns of using eval, or the complexity of creating a sandboxed environment for potentially unsafe code.

Last note: while this solution may be more secure than eval, it is definitely not 100% secure. In the simple example above, we do escape strings so SQL injection shouldn’t be a problem, but it doesn’t check if the column defined by the attr function is valid, or if the user is allowed to query information based on that column or not (although something like that would be possible). I would not use something like this to process completely untrusted input.